
The economy has been quietly adding hundreds of thousands of new jobs, and AirDNA data shows that Short-Term Rentals demand and bookings are actually up over 2021.

Unless you’ve spent 2022 in an off-the-grid Airbnb cabin, the uncertainty of the American economy is likely on your mind, and it’s changing the way many think about markets and investment. Supply chains are experiencing disruption globally, and gas prices are elevated, in part due to the war in Ukraine; inflation persists above 8%, and the stock market has dropped more than 20% this year so far (Moody’s Analytics). The same concerns apply to short-term rental (STR) entrepreneurs.
Yet, it’s also important to look at other performance indicators. The economy has been quietly adding hundreds of thousands of new jobs, and AirDNA data shows that STR demand and bookings are actually up over 2021.
This is where our mid-year Outlook Report comes in. Below, we cut through all of the static and provide a clear update on how today’s economic trends will (or will not) impact the future of your short-term rental business.
The travel sector is one of the main bright spots of the U.S. economy, with the industry now almost fully recovered from the pandemic. Some key recent metrics:
- The number of airline passengers in the U.S. is up 20% over the past year as of June 2022 and is now just 12% below 2019 levels, according to the TSA.
- According to hotel data company, STR, U.S. hotel revenue per available room (RevPAR) reached $97.53, 7.7% above 2019 levels with total nights sold just 2% from full recovery.
- Auto trips have remained strong throughout the past two years, and even with gas prices at $5 per gallon, 56% higher than at the same time last year, the number of overnight road trips is up by 0.5% and remains above 2019 levels, according to Arrivalist.
- Growth for stays in a short-term rental has been relentless and was up 21% in Q2 2022 year over year, having already surpassed pre-pandemic levels in 2021.
Despite high inflation and an elevated risk of recession, according to some analysts, demand for travel—especially for short-term rental (STR) stays—has grown substantially throughout the first half of 2022 and is likely to continue into the last half of the year.
U.S. Short-Term Rental Outlook
Highlights from our updated 2022 forecast:
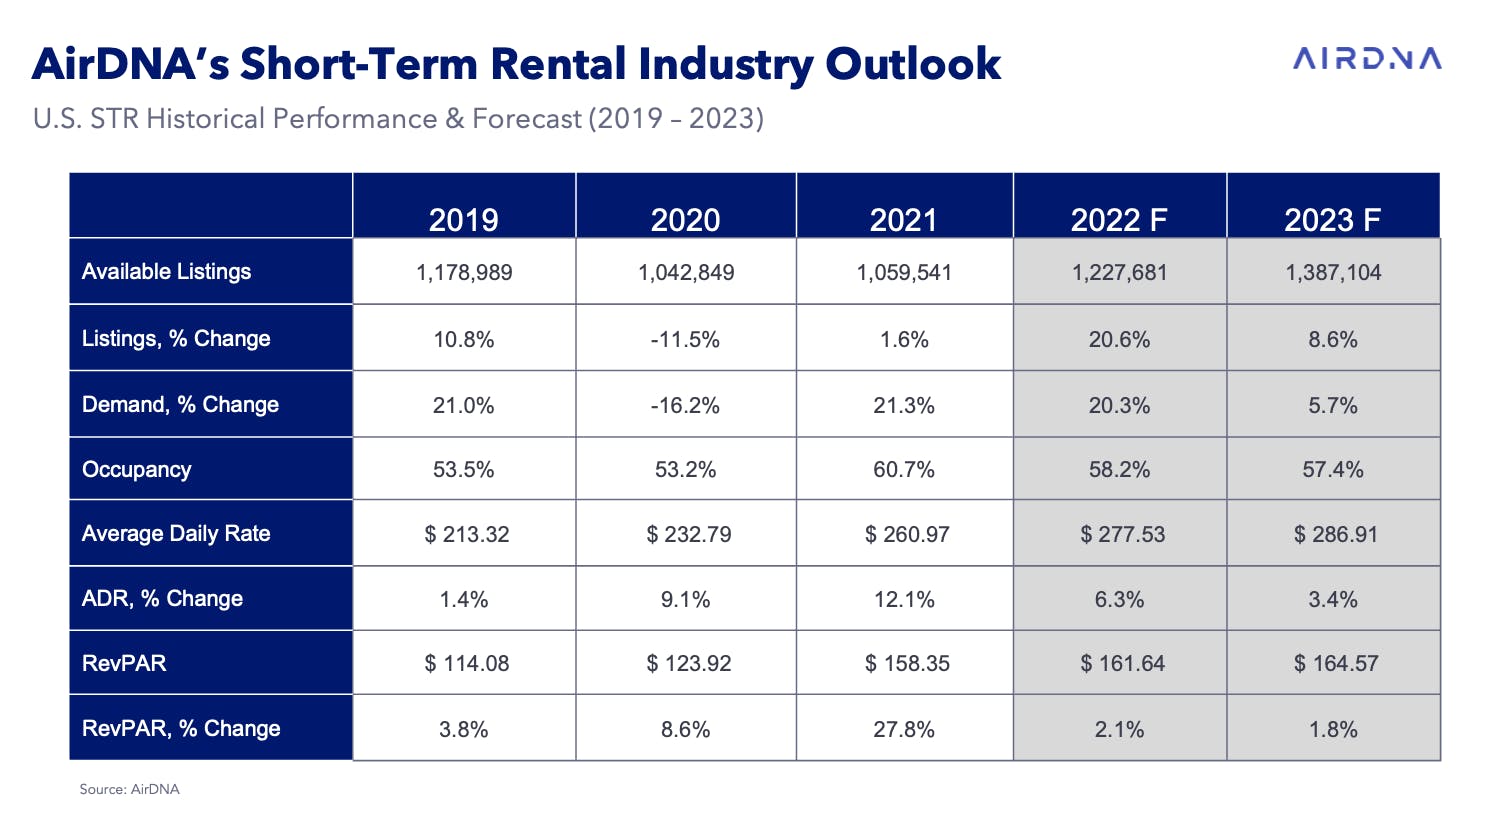
- Demand: Through the first five months of 2022, demand has averaged 26.7% higher than in 2021. This is 3.8% higher than we had forecast last fall. The stronger demand, combined with more available supply, has led us to revise our projections upward to 20.3% growth for the year, compared to our previous forecast of +14.1%.
- Supply: After a surprising lack of supply growth in 2021, new listings on Airbnb and Vrbo have accelerated in the first half of 2022. We now expect available U.S. short-term rental listings to increase by 21%.
- Occupancy: With supply outpacing demand growth as expected, our outlook for occupancy is largely unchanged. Our revised forecast now calls for U.S. occupancy to average 58.2% for the year, slightly lower than our 59.8% forecast in October.
- Average Daily Rates (ADRs): Inflation that has been pervasive throughout the economy and continued strong demand during peak periods have allowed hosts to increase ADRs to keep pace with rising costs. ADRs are forecast to increase 6.3%—well below the 12.1% increase in 2021 but significantly higher than the 4.1% drop we had expected.
- Revenue: Increasing ADRs will just barely allow hosts to maintain higher average revenue per listing in 2022 and offset falling occupancy. On average, listings are expected to earn just 2.1% more revenue in 2022 compared with 2021.
Supply Growth Will Slow
In May 2022, there were 88,000 new short-term rentals added in the U.S., reaching a new high for available listings. Given the impressive increase in returns, it's no surprise that real estate investors accelerated their additions to supply in the beginning of 2022. Going forward, though, we expect supply growth to slow.
STR Revenue Premium Hits a Four-Year Low as Interest Rates Rise
The cost of buying a home has also been pushed significantly higher in a short period of time by a combination of two factors: rising home prices—up over 20% in just the past year—and rising interest rates. Interest rates have gone from 2.8% for the average 30-year fixed mortgage to 5.8% as of the end of June. We estimate that the average 30-year fixed mortgage payment for a higher-end home has risen by 58% in the past year.
With short-term rental revenues having largely plateaued in the past year, the expected premium (monthly expected STR revenue/average monthly mortgage cost) for buying a short-term rental investment has dropped from over 80% at its peak last summer to just 30% as of May 2022. This is the lowest level it has been in the past four years, functionally just enough to cover the cost of the average property management fee. We expect these factors to continue into 2023, which could temper the rate of growth going forward. Vacation rental managers will need to choose very carefully to find the most profitable properties.
Our forecast calls for the number of available listings to average almost 1.4 million in 2023, an 8.6% increase from 2022. Meanwhile, we expect 2022 available listings to average 20.6% higher than 2021.
In May and June 2022, occupancy fell by 8.6% and 9.9% year over year, respectively, as demand failed to keep up with surging supply. It's important to note that 2021 was an anomaly for the short-term rental industry, with demand hitting record highs and supply contracting, as many owners used their STRs for their own use, found long-term renters, or sold their property. This scarcity of available listings pushed occupancy into the stratosphere—to levels unlikely to be replicated.
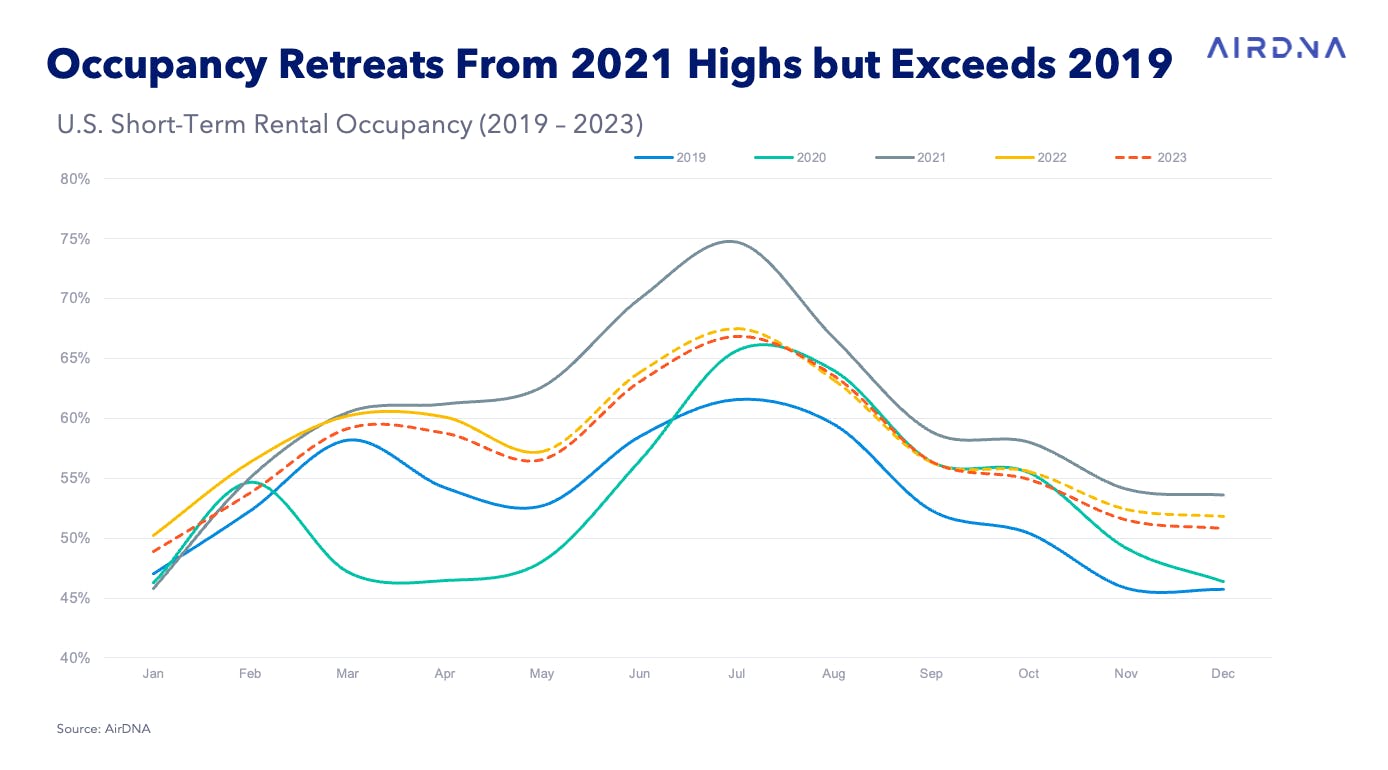
That said, occupancy remains at historically high levels. For the first half of 2022, occupancy was still 7.5% higher than in 2019, while just 1.2% below 2021 levels. Occupancy has increased substantially over the past year in urban and suburban areas—both are up more than 5% year over year—as they finally recoup their losses from the COVID-19 pandemic. However, even with the recent gains, urban occupancy is still 1.2% below 2019 levels, the only U.S. location type with occupancy below pre-pandemic levels.
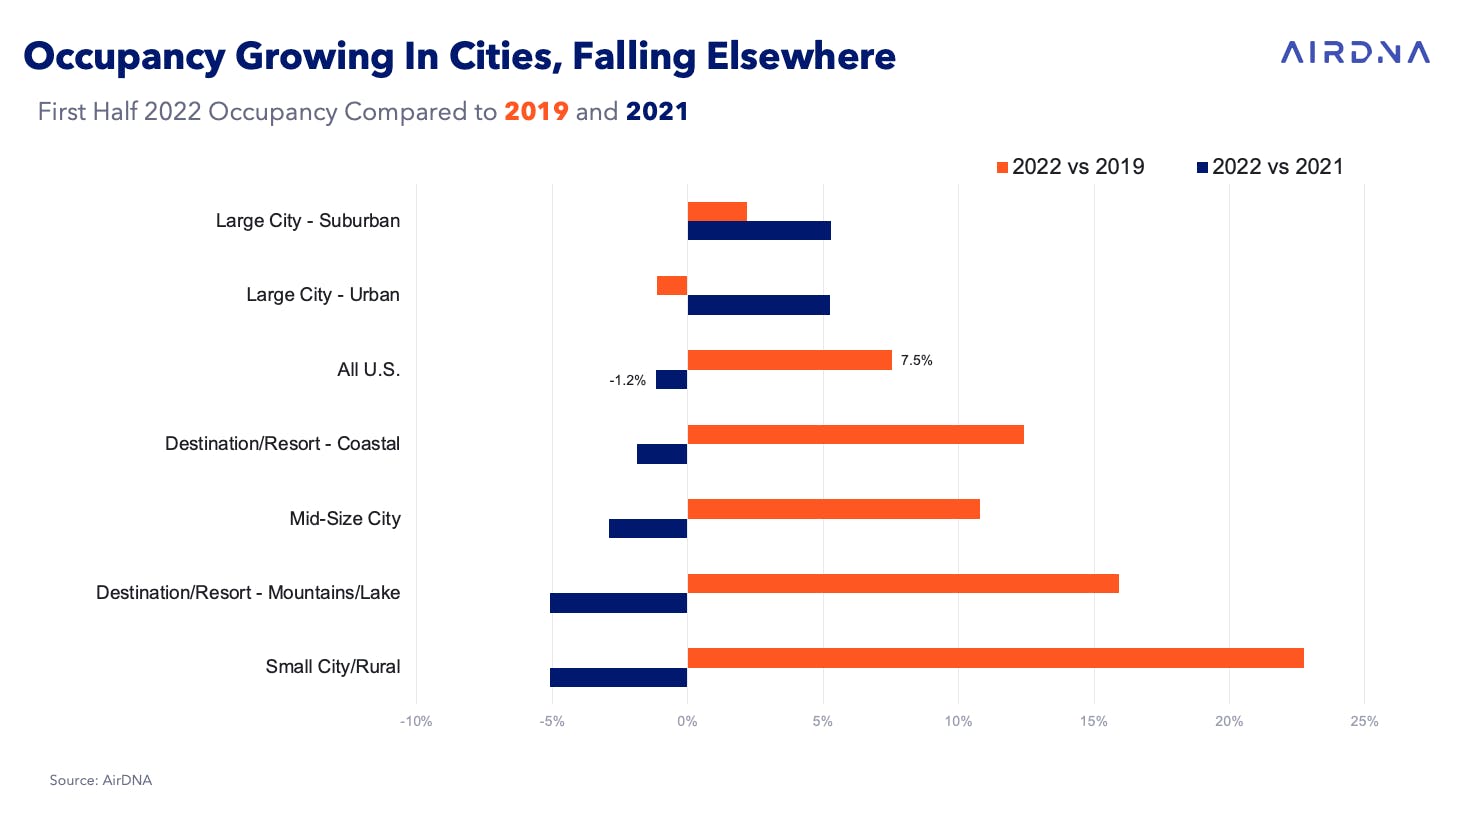
Elsewhere in the U.S., occupancy is pulling back from 2021 highs. Occupancy in mountain and small city/rural locations has declined more than 5% year over year. This still remains 15% to 25% higher than in 2019 but may fall in the years to come as supply increases to meet demand. All location types have averaged double-digit demand growth year over year in the first half of 2022; this has just paled in comparison to growth in new listings. Overall occupancy is expected to average 58.2% in 2022 and then drop to 57.4% in 2023.
High Occupancy, Rising Costs Drive ADR Growth
Average rates for short-term rentals have increased by 10.4% year over year so far in 2022 and are forecast to grow by 6.3% over 2021 for the full year. So far, price increases have exceeded the rate of inflation, but as occupancy continues to decline, competition to attract guests may push hosts to start lowering rates in order to maintain their share of booking activity.
ADR gains have been highest in urban and suburban areas, where hosts are able to take advantage of rising occupancy and recovering demand.
Looking forward, ADR growth is expected to slow as we push past peak rates of inflation. Easing pressure on gas and wage prices will help to reduce the need to raise ADRs to cover rising costs. Another factor is strong demand growth in urban and suburban rentals, which generally charge lower rates. We expect ADRs to grow another 3.4% in 2023, almost half the growth rate of 2022.
Demand Moves From Booming to Steady Growth
2022 will be a record year for STRs, with more nights stayed in a rental than at any other point in history. While 2021 will go down as a high point for occupancy, higher supply in 2022 is allowing more people to experience short-term rentals, especially during peak periods in which many markets were constrained in 2021. As we look to 2023, the risk of recession and slowing growth will weigh on short-term rental demand growth. Our expectation is that demand will grow at 5.7% for the year, about a quarter of the growth rate in 2022.
Cities on the Move: Demand in Major Cities Skyrockets in 2022
Throughout 2021, urban demand had a relatively strong recovery, going from down roughly 50% to down just 29% in Q4 2021 compared to the same period in 2019. However, urban demand growth has slowed in recent quarters. As of Q2 2022, demand was still 21.6% below 2019. Unlike urban areas, demand recovery accelerated in 2022 in suburban areas, growing from down 9.2% to up 10.8% when compared to the same quarter in 2019.
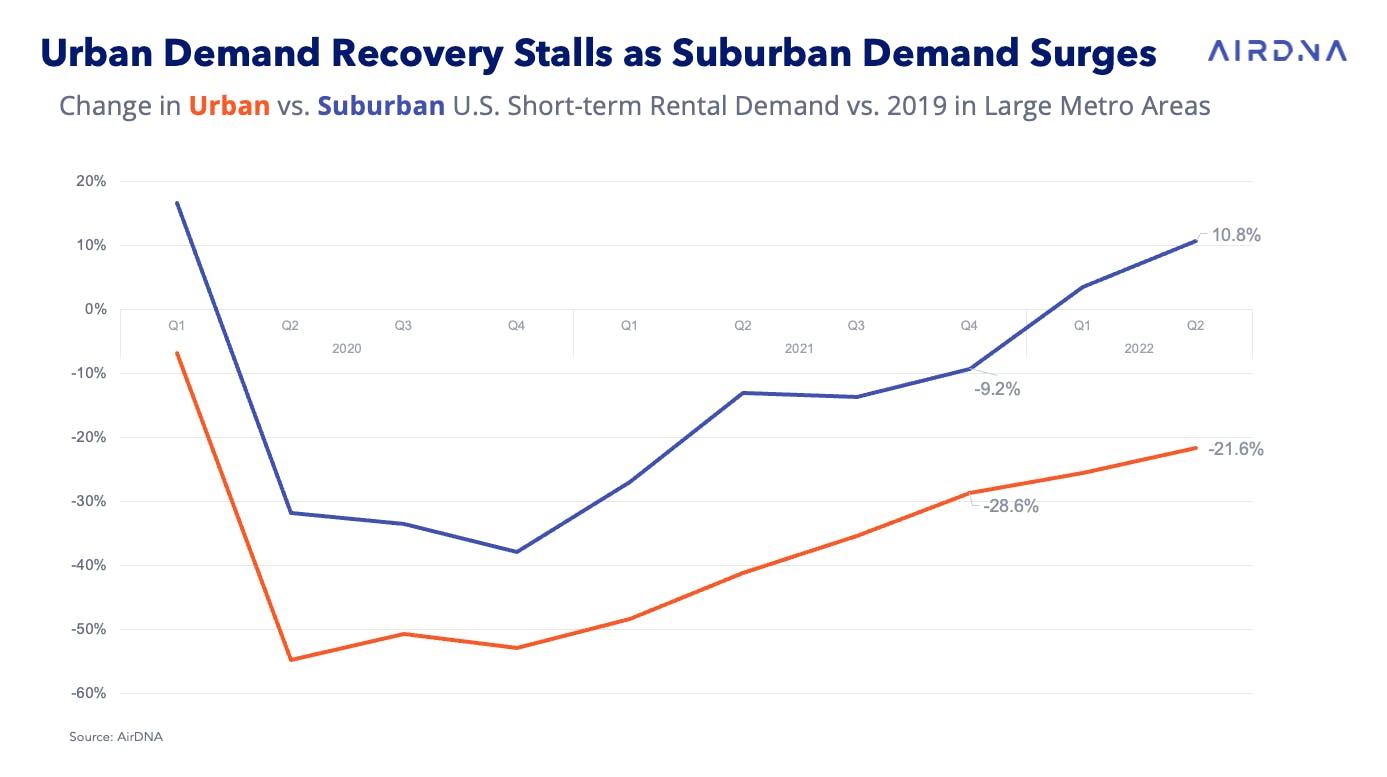
Suburban areas of the largest U.S. cities have benefited the most from longer-term stays that added incremental new demand to the short-term rental sector throughout the pandemic. In Q2 2022, more than 22% of nights booked in suburban areas were for 28 days or more compared to 18% for urban areas and just 8% for destination/resort markets. All areas have seen demand for longer-term stays dissipate in 2022 from 2020 highs, but suburban properties have been able to hold onto most of their gains, as they peaked at 25% of demand in Q2 2020 and have only come down to 22%.
We have widely reported on market trends across cities, with markets in the south, such as Tampa, Florida, San Antonio, and Houston, well exceeding 2019 levels of demand. Meanwhile, guests have yet to return in their 2019 numbers to Boston, New York, Oakland, California, and Washington, D.C.
It is interesting to see that demand recovery is varying dramatically within the same markets. While most markets are following the national trend of suburban areas recovering quicker than urban areas, some cities are seeing the exact opposite. For example, in Miami, New Orleans, and Orlando, Florida, 2022 demand is higher relative to 2019 in the urban areas of the city compared to the suburbs. In Orlando, which relies heavily on demand for theme parks, much of it coming from international visitors, suburban demand is still down by 14.2%. However, in downtown Orlando, demand is up by over 27.2% when compared to 2019.
There are also examples of markets where demand appears to be weak, such as Chicago, Denver, and Seattle, but that weakness is almost entirely associated with the urban areas, while demand is stronger in the suburban areas of these cities today than in 2019.
International Travel Picks Up in 2022
Limited international travel to the U.S. has been a significant factor impacting the recovery of demand for some major cities, especially their urban areas. According to the National Travel and Tourism Office (NTTO), travel spending by foreigners visiting the U.S. is still 42% below 2019 levels as of April 2022, although this is a significant recovery from the same time last year when spending was still down by 87%.
When we look at the return of foreign guests staying in U.S. STRs, the story looks similar. We estimate that, in April, demand from foreign guests was 44% lower than 2019 levels (compared to -42%, according to NTTO data) and has deteriorated slightly through May to -46%. This suggests the growth in 2022 can be attributed more to domestic rather than foreign travelers. The strong dollar will reinforce this trend this summer as travel is relatively more expensive for foreign travelers visiting the U.S. and less expensive for Americans traveling overseas.
The rate of recovery is expected to slow somewhat, even with travel restrictions easing. Tourism Economics forecasts that international spending in the U.S. will fully recover by 2024. Given that the STR demand growth rate is much stronger than other forms of lodging, we expect that STR demand will return to 2019 levels by the end of 2023.
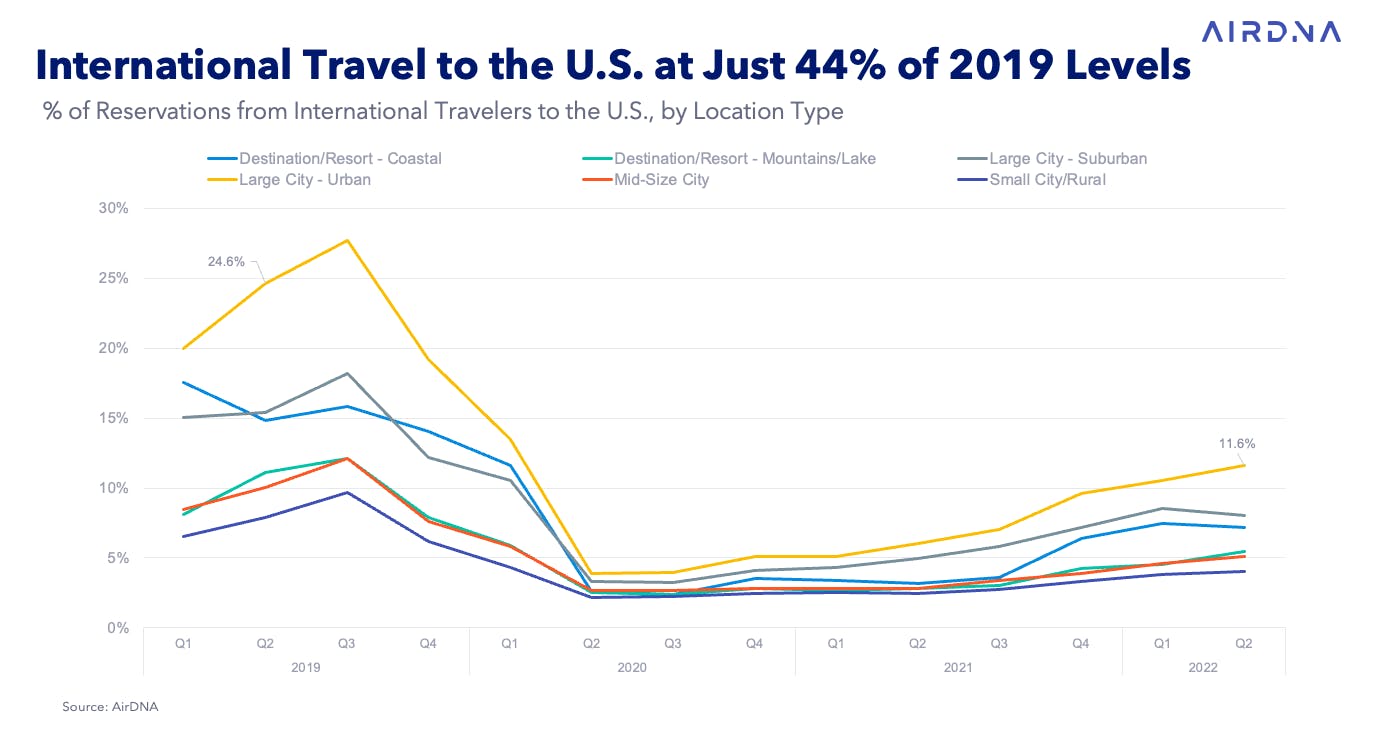
International travel demand is picking up in 2022 across all U.S. location types but is most noticeable in urban areas, where it now accounts for 12% of all reservations. In Q2 2019, foreign travelers accounted for a full quarter of all stays in urban markets. Nevertheless, the 15 markets most dependent on international travel all still have some way to go in reclaiming that demand. Miami has made the biggest strides towards recovery thus far, with international demand down just 35% from 2019 levels. Naples, Florida, meanwhile, has had the toughest time attracting international guests and is still 65% below pre-pandemic levels.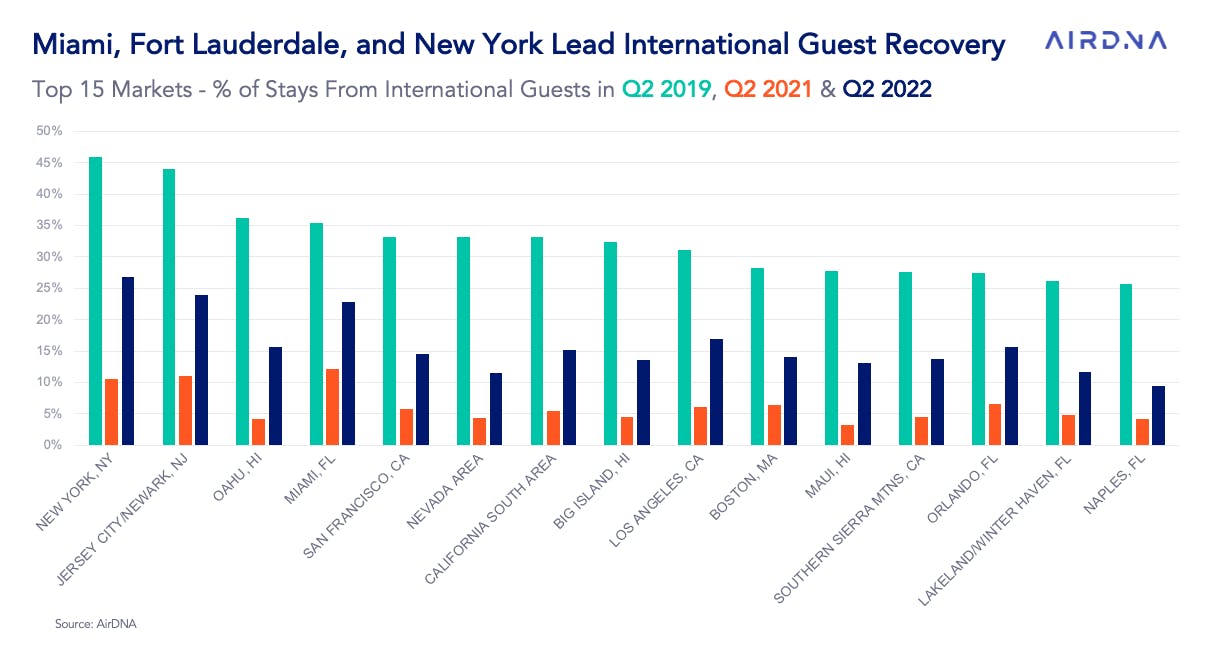
New York is the market leader for international travelers, with 27% of its stays coming from foreign guests in Q2 2022, followed by nearby Jersey City/Newark, New Jersey (24%), and Miami at 23%. For many markets, changes in international travel will continue to have little impact on the market. In Broken Bow Lake, Oklahoma, and the Ozark Mountains, Missouri, fewer than 2% of guest stays are from foreign guests, with little change in that figure since the onset of the COVID-19 pandemic.
Visitors from Canada and the United Kingdom lead the rankings of inbound guests at 24% and 13%, respectively, with their share of foreign travelers increasing slightly over the past few years. The recovery of inbound travel was spurred by the opening of the U.S.-Canada border last summer, and since then, travel by Canadians to the U.S. has increased substantially. Travel by guests from Australia and China has lagged behind other major countries thanks to strict border controls, and they now make up a significantly smaller proportion of travelers to the U.S. than they did prior to the pandemic.
Demand Remains Strong in Coastal and Mountain Destinations
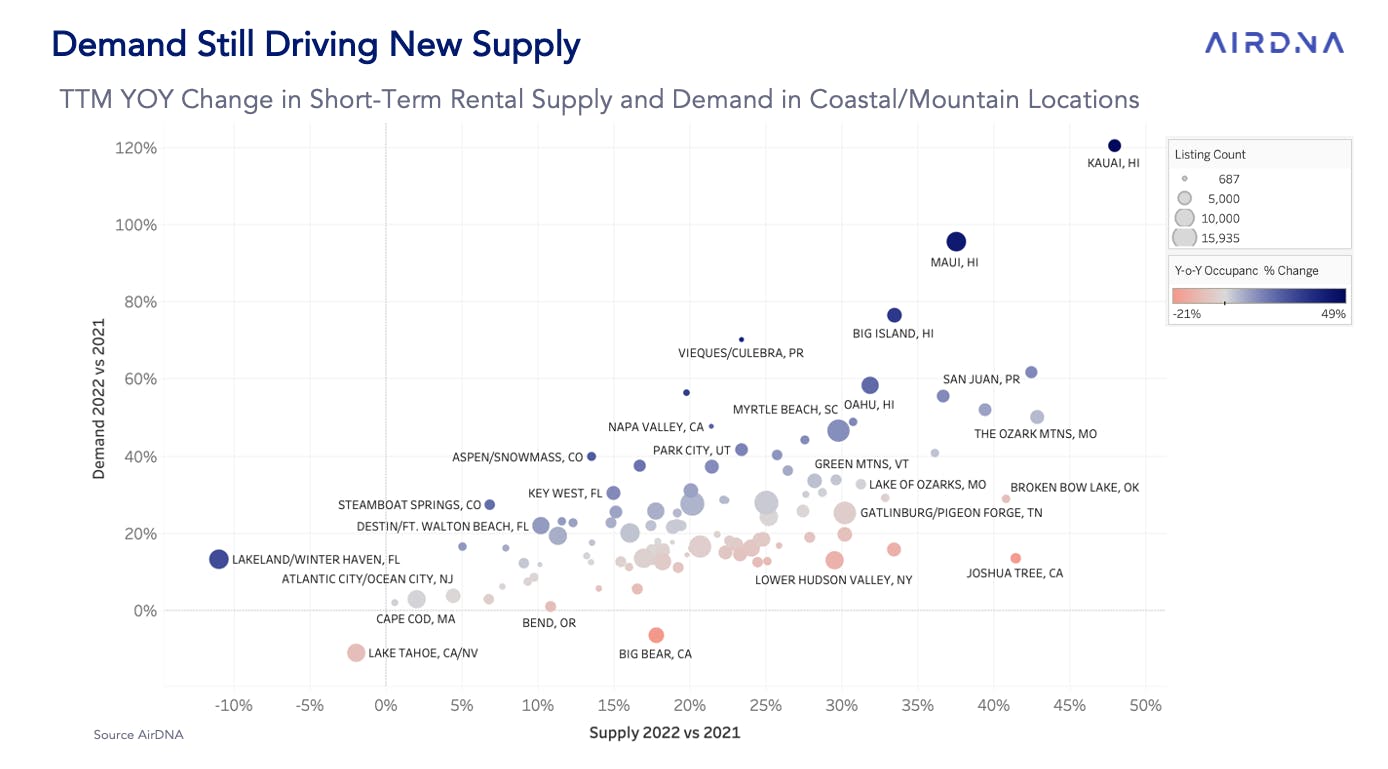
Demand for short-term rentals in coastal and mountain regions remains strong and has grown in lockstep across both location types during the pandemic. As of Q2 2022, demand was up roughly 40% over Q2 2019 and also increased on a year-over-year basis, where it was up about 9%. Many markets have benefited from easing COVID-19 restrictions over the past year, with markets in Hawaii and Puerto Rico realizing some of the largest gains in both demand and occupancy.
On the scatter chart below, markets with weakening occupancy are broadly on the right side, where new supply outpaces gains in demand. Occupancy declined most in Joshua Tree, California, where supply has risen more than 40% relative to just a 10% increase in demand over the past year. Big Bear and Lake Tahoe, also in California, were the only markets to register a decline in demand over the period.
More Nights Will Be Stayed in an STR Than Ever This Summer
As we look to summer 2022 (June-August), more STR nights have been booked than any other summer in history, as of the end of June. The previous record was set just last year, and the U.S. is currently seeing 12.3% more booked nights than at the same point in time in 2021. ADRs are also pushing higher, up 7% this summer from last year. ADR growth is strongest in urban and coastal regions, up more than 11% over 2021.
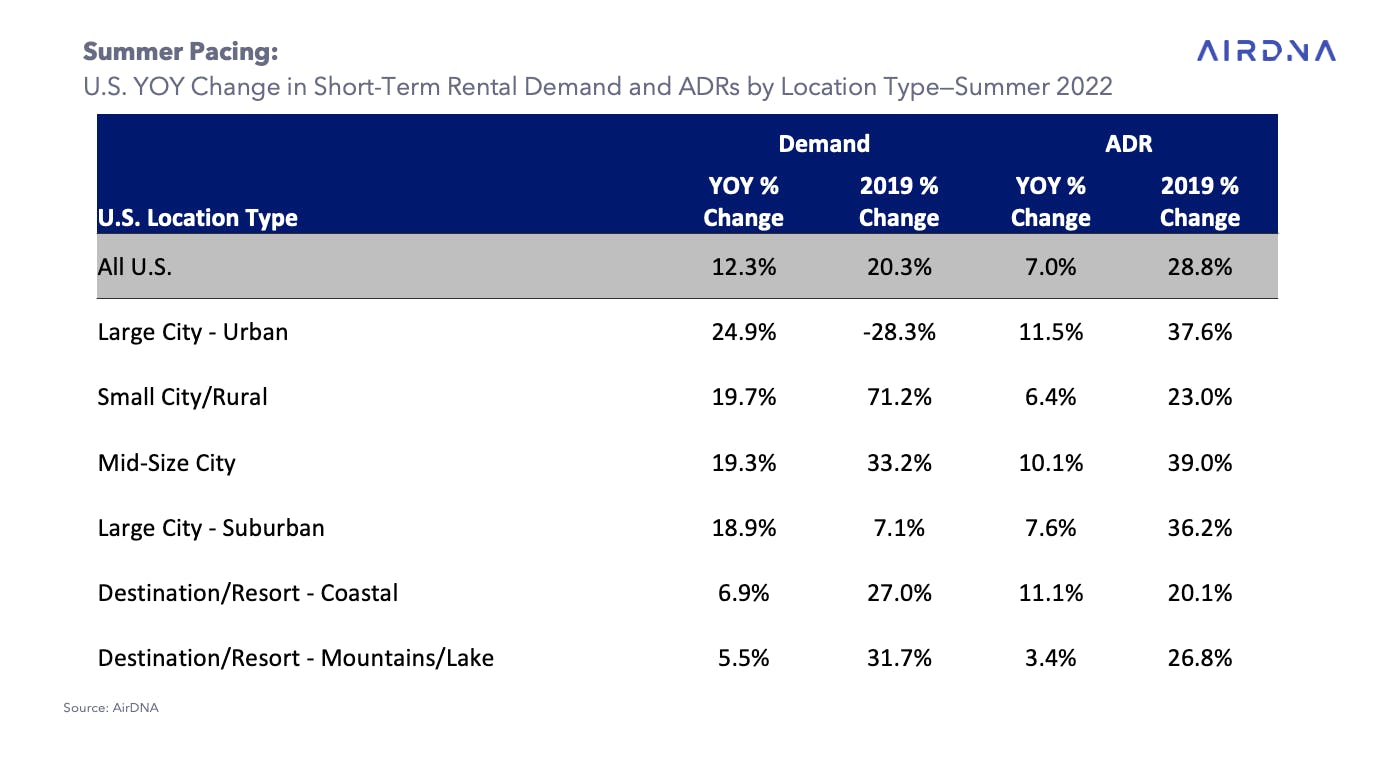
While urban demand is strongest on a year over year basis, it still has some catching up to do and is currently pacing 28.3% below 2019 levels. All of the top 50 markets for summer 2022 demand pacing vs. 2021 are either large or midsize cities, highlighting the strong trend of travelers returning to cities this summer.
Two midsize cities, Eugene, Oregon (+66.5%), and Birmingham, Alabama (+66.1%), lead the top 15 markets for year-over-year demand growth this summer. Other notable strong growth cities include Pittsburgh (+52.8%), New York (+51.4%), and Jersey City/Newark, New Jersey (+50%). Lake Tahoe, California (-22.1%), the U.S. Virgin Islands (-19.1%), and Winter Park/Fraser, Colorado (-13%), on the other hand, round out the markets expected to decline in demand this summer as these markets revert to their more typical seasonality patterns.
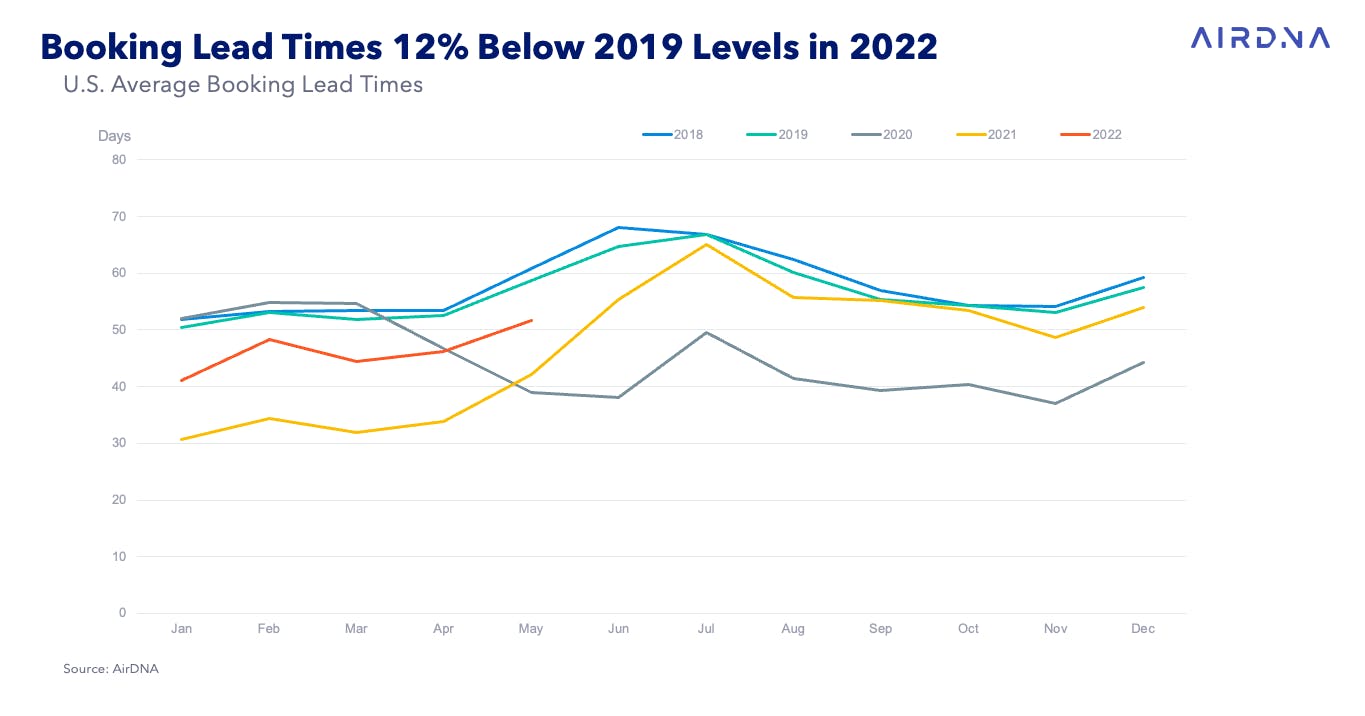
It's more than likely that demand will end up even higher than it is pacing today, as lead times—the time between when someone books a reservation and when the reservation starts—are still lagging behind 2019. For example, in May 2019, the average reservation was made about 59 days in advance, but just 51 days in 2022, a 13% shorter lead time.
Spending Slows, But Employment Remains Strong
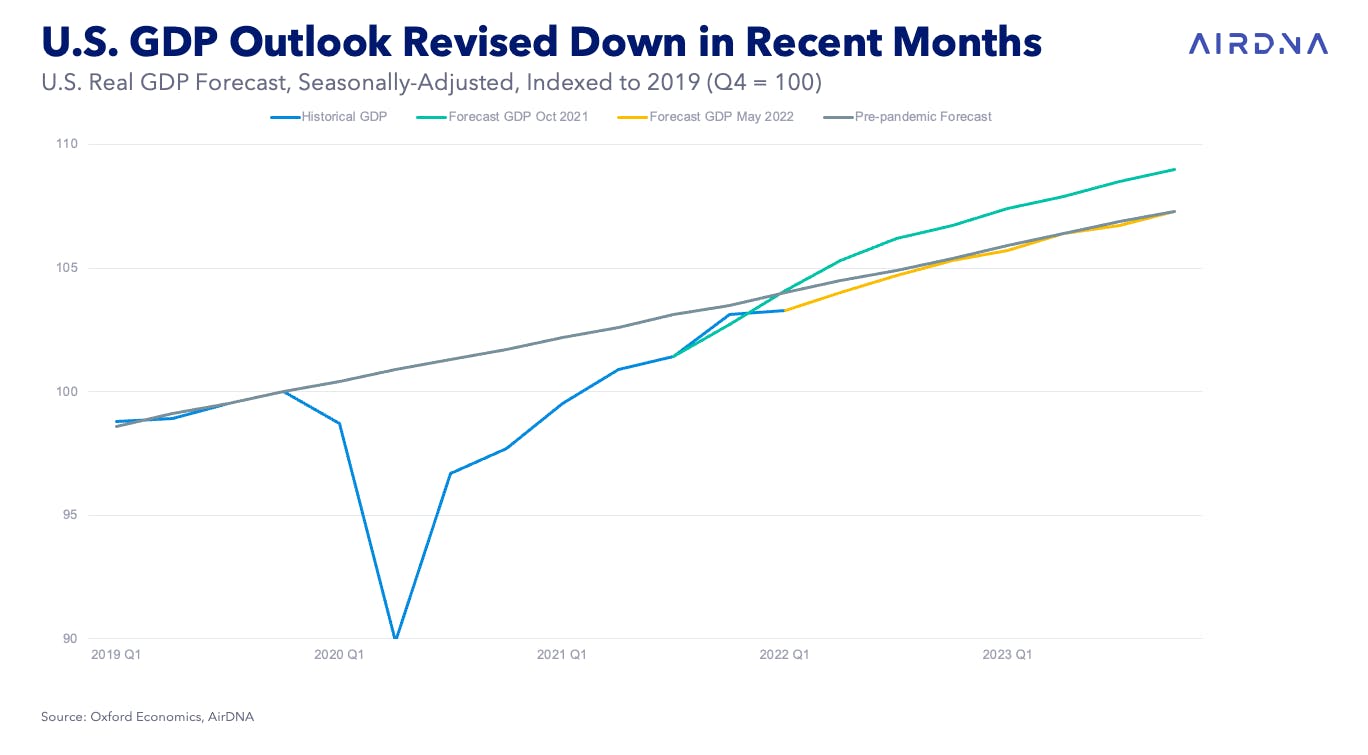
Since our last Outlook Report in December 2021, forecasts for just about all measures of economic activity have slowed considerably. The Oxford Economics forecast for year-end 2023 gross domestic product (GDP) has been revised down by 1.3% since October, reflecting the slowing economy and falling GDP in Q1 2022.
Historically, two variables have been strong predictors of future lodging demand: employment and real personal income. Employment has continued to be a bright spot in the economy and shows little evidence of turning negative. In June, the U.S. added 372,000 jobs, and the unemployment rate dropped to just 3.6%. There are still roughly two job openings for every unemployed worker, pointing to an economy in which just about everyone who wants a job is able to find one.
Throughout the pandemic, as people sheltered in their homes, spending on goods increased dramatically, while spending on services—especially travel—fell severely. Fast forward to 2022, and spending growth is slowing, driven by a combination of low consumer confidence, stock market declines eating into savings accounts, and inflation reducing spending power.
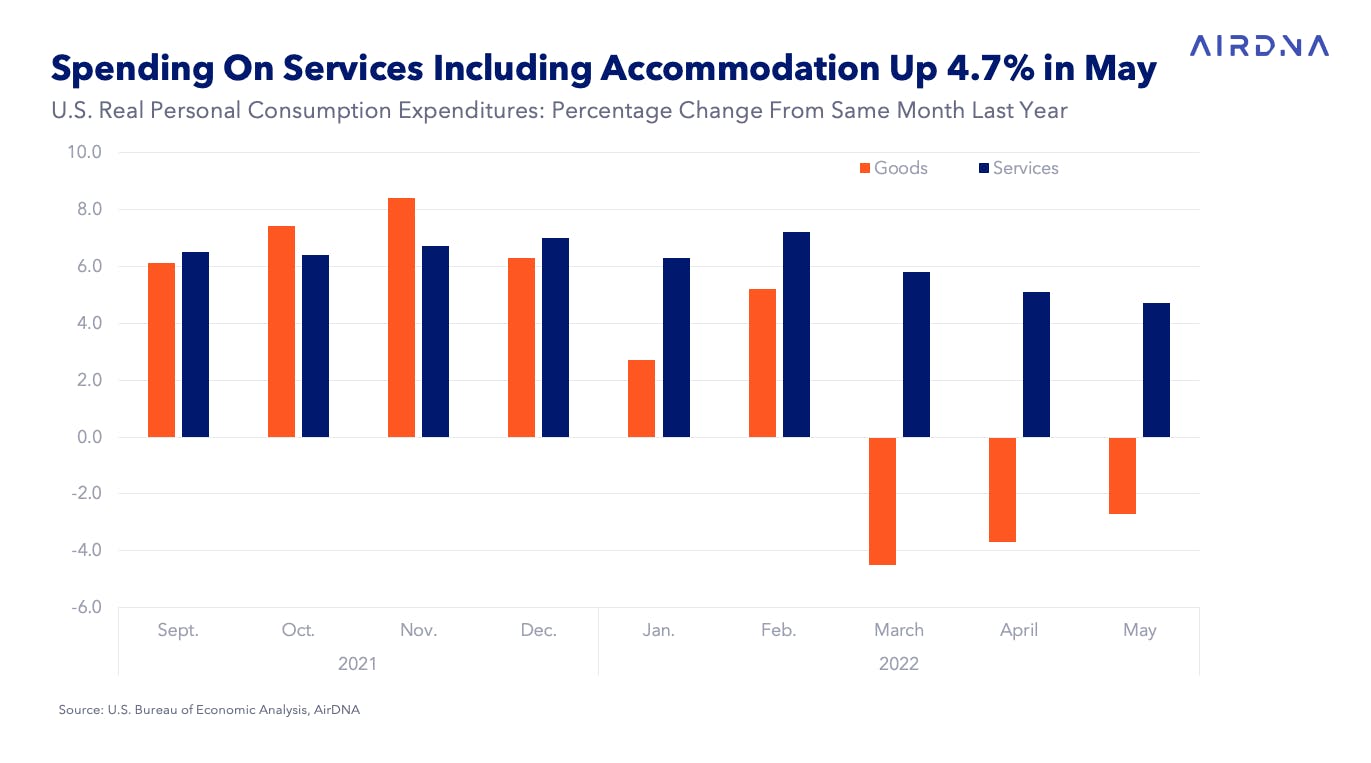
So far, consumer spending has continued to grow overall, but spending on goods has pulled back. Meanwhile, spending on services has continued to grow at or above 5% year over year for the last 12 months. The pace of spending is expected to slow further in 2023, with Oxford Economics expecting an increase of just 2%.
Overall Bright Outlook For 2022—For Now
So is the golden age of the STR sector over? Not really: 2022 should prove to be another record year for the industry. Now is the perfect time to get smarter and more creative about where you invest. For hosts and managers, think about how you can fortify your existing properties and stay ahead of the competition through strategic pricing. For investors, take the time to find the best properties and think about where your market will go in the next few years before you buy. As the market normalizes—with supply rising to meet demand, stock markets correcting, and oil prices increasing—remember that services spending remains a priority for many Americans. This means there’s no shortage of opportunities to be on the right side of any economic downturn.
This article originally appeared on AirDNA.