
Global Performance
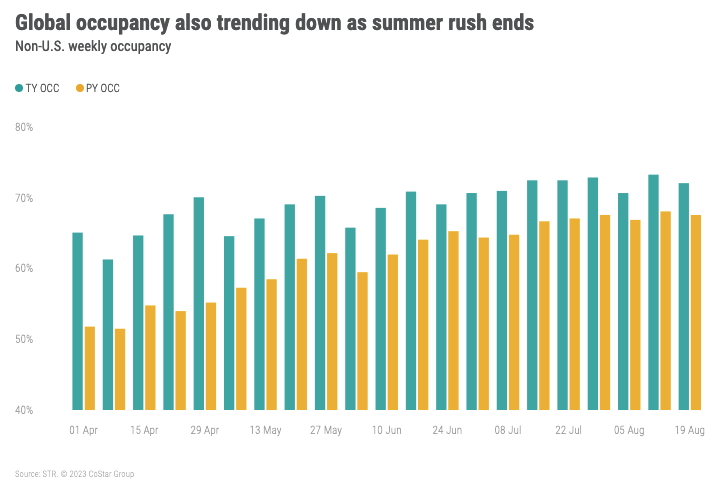
Global performance (excluding the U.S) showed a marginal week-over-week decrease in occupancy, down 1.2ppts to 72.1%, which is in line with historical patterns and expected given the industry’s seasonality. While occupancy was down from the prior week, it was up 4.4ppts YoY. ADR was up 12.8% YoY to US$154 and has been above US$150 for the past 11 weeks. RevPAR came in at US$111, up 20.2% YoY.
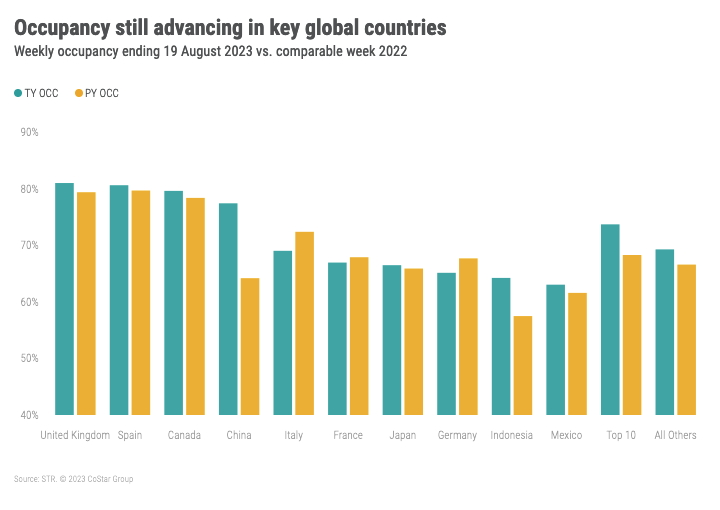
The Top 10 countries, by supply, posted occupancy of 73.7%, up 5.4ppts YoY but down 2.4ppts from a week ago. ADR grew 9.5% YoY to US$143. RevPAR was the eighth highest result of the year at US$105 with growth of 18.2% YoY.
Within in the Top 10, France, Italy and Germany reported slight year-over-year declines. The U.K had both the highest occupancy (81%) of the top 10 and the largest year-over-year gain (+1.6ppts) among those in Europe. Overall, the largest occupancy gainers are those in Asia with occupancy in China up 13.2ppts YoY to 77.4%, its second highest occupancy since March 2020, and Indonesia, up 6.8ppts to 64.3%. Canada saw its highest occupancy (79.6%) since March 2020 at the peak week of the summer travel season. Additionally, several markets saw higher occupancy from evacuees fleeing the fires in northern Canada. In Spain, occupancy grew to 80.6% with ADR rising 3.3%. Rates in Spain have been at their highest levels over the past three weeks. This most recent week’s ADR was 22% higher than the comparable week of 2019.
Outside of the top 10, Seychelles had the highest occupancy in the Middle East/Africa region at 77.9%, up 0.5ppts YoY. Ireland topped the list for Europe at 90.8%, up 2ppts. Singapore once again posted the highest occupancy in Asia Pacific (86.7%, up 15.1ppts), and El Salvador experienced the highest YoY occupancy gain in the Americas at 82.4% (+22.2ppts).
U.S. Performance
With almost two-thirds of U.S. K-12 students back in school, hotel occupancy followed normal seasonal patterns and trended down for a fourth consecutive week. The industry lost 1.3 percentage points (ppts) from the prior week, and at 67.0%, was unchanged from a year ago but down 2.9 ppts from the same week in 2019. Occupancy is expected to trend down week on week through Labor Day and then grow as group/conference travel climbs to its annual peak. Weekly revenue per available room (RevPAR) increased 1.8% year over year (YoY) to US$103, driven by a 1.8% increase in average daily rate (ADR) to US$154. ADR gains took a step back following three weeks above 2%. Real (inflation-adjusted) ADR remained just under the 2019 level.
Weekday (Monday – Wednesday) occupancy increased 0.4ppts YoY while shoulder (Sunday and Thursday) and weekend (Friday and Saturday) periods declined 0.5ppts and 0.3ppts, respectively. Weekday occupancy has increased in 25 of the past 33 weeks this year as compared to 12 and 16, respectively, for weekends and shoulder days.
The Top 25 Markets saw stronger occupancy growth compared to the rest of the country, rising 0.7ppts YoY to 68.6%. In all but two of the 33 weeks of 2023, the Top 25 Markets have seen better occupancy gains than the rest of the country. Occupancy outside the Top 25 came in at 66.1%, down 0.5ppts YoY. RevPAR for the Top 25 Markets increased 3.2%, fueled by an ADR increase of 2.1%. In the remainder of the country, ADR grew 1.5%, resulting in RevPAR increase of 0.9%.
Top 25 Market weekday occupancy showed the best year-on-year increase (+1.5ppts), followed by shoulder days (+0.5ppts). Weekends in the Top 25 Markets decreased slightly, -0.2 YoY. This pattern continued with the healthiest ADR gains for weekdays (+3% YoY) yielding a RevPAR gain of 5.4% YoY. Shoulder days produced ADR growth of 2.2% resulting in a 3% RevPAR gain. The weekend showed a 1.0% ADR increase and a 0.7% RevPAR increase.
Outside the Top 25 Markets, occupancy was down across all day parts with weekdays decreasing the least (-0.1ppts). Weekdays produced the highest ADR increase (+2.1%), resulting in a RevPAR gain of 1.9%. Weekend RevPAR increased 0.8% while shoulder days were down 0.8%.
The nation’s highest occupancy for the third consecutive week was in Alaska (89.5%) followed by Oahu (88.4%) and Portland, ME (85.9%).
The devastating fire on Maui, which caused a 27.8% YoY decrease in room demand, continued contributing to Oahu’s occupancy performance. Based on CoStar hospitality research and individual hotel reporting status, five properties representing 1,904 rooms in Maui have sustained damage or were destroyed. That total represents roughly 2% of room supply in the Maui market.
New York City was the only other Top 25 Market, besides Oahu, recording occupancy above 80%. New York occupancy increased 6.3ppts to 83.7%, resulting in the highest RevPAR increase (+19.7%) across all Top 25 Markets, assisted by a healthy 10.7% ADR increase. Overall, weekday occupancy increased 1.5ppts across the Top 25 Markets, but many saw even higher growth, including Las Vegas (+2.5), Minneapolis (+2.2), Houston (+2.6), Detroit (+8.4), Nashville (+1.8), Atlanta (+3.8), and Houston (+2.6).
Across the chain scales, Upper Upscale (68.9% occupancy) experienced the largest yearly occupancy (+2.5ppts) and RevPAR (+4.4%) gains. Upscale reported the highest occupancy (+1.0% to 73.3%) and a 3.7% RevPAR gain. Luxury occupancy advanced 0.8ppts to 64.2%, but RevPAR decreased 2.8% because of a 4.0% ADR decline. Occupancy across the remaining chains scales fell from -0.2ppts in Upper Midscale to -0.7ppts in Midscale to -1.8ppts in Economy. Upper Midscale increased ADR 2.1%, resulting in a 1.8% RevPAR increase. ADR remained almost flat for the other two chain scales, netting RevPAR changes of -1.1% for Midscale and -2.6% for Economy.
Group demand among Luxury and Upper Upscale hotels, which is generally slow during this time of year, increased 1.1% compared to the same week last year. Over the past four weeks, group demand was up 1.8% compared to the same four weeks last year. The group segment is expected to see week-over-week decreases but year-over-year gains through the Labor Day holiday followed by strong growth up until the holidays.
Final thoughts
U.S. demand has flattened overall compared to a year ago, but travel remains strong given that air travel, based on weekly TSA screenings, has been above 2019 levels in 23 of the past 24 weeks. Americans, traveling internationally at much higher levels than their global counterparts, are helping to lift performance in other countries while softening performance domestically. The industry is in a period of normalization as it readjusts to seasonal patterns. Adjustments in terms of stronger demand in the Top 25 Markets while the rest of the country slows as well as strength across all markets on weekdays reflect this return to normal. Moving into the fall season, the industry is counting on business/group travel to advance, further propelling the industry’s return to normal.
Looking ahead
U.S. occupancy will see normal demand and occupancy declines heading toward a summer seasonal low in the week containing Labor Day. Thereafter, we expect both measures to rise, but the magnitude of that growth is dependent on the strength of group/conference travel and the ongoing recovery in business transient demand. Global occupancy will also trend down as the leisure season comes to an end in the western hemisphere
This article originally appeared on STR.